Volume Shader BM: Browser GPU Test
Run a 45-second WebGL 2.0 test on your phone or PC to measure average FPS and stability. The latest 10 results are saved in this browser for repeat comparisons.
Rendering engine
Test not started
Start a medium-load test to measure FPS for 45 seconds. Keep this tab visible until it finishes.
Device and browser
Tests saved in this browser (0)
The latest 10 results stay in this browser. Temperature and power settings can still affect comparisons.
Complete a test to start your local history.
Different scenes and workloads. Compare results within the same engine.
What is Volume Shader BM? How to read your FPSWebGL 1.0 and WebGL 2.0 render comparison
The two engines render different scenes, shown below. Their FPS and scores cannot be compared directly.
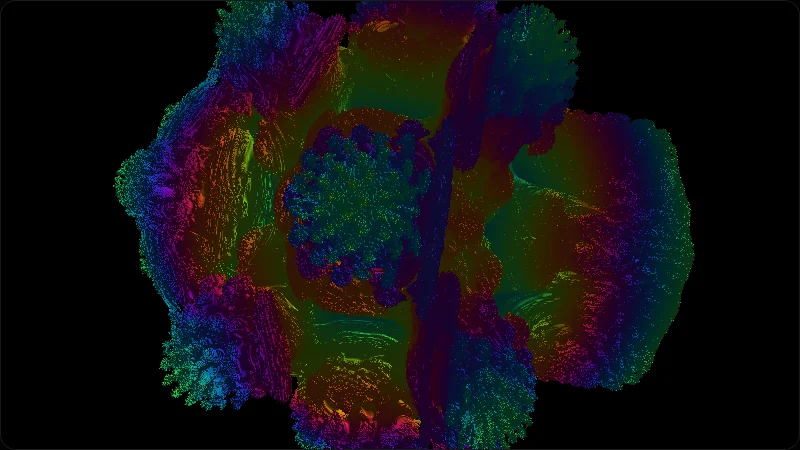
WebGL 1.0 original fractal scene
The scene used when you start the WebGL 1.0 original algorithm.
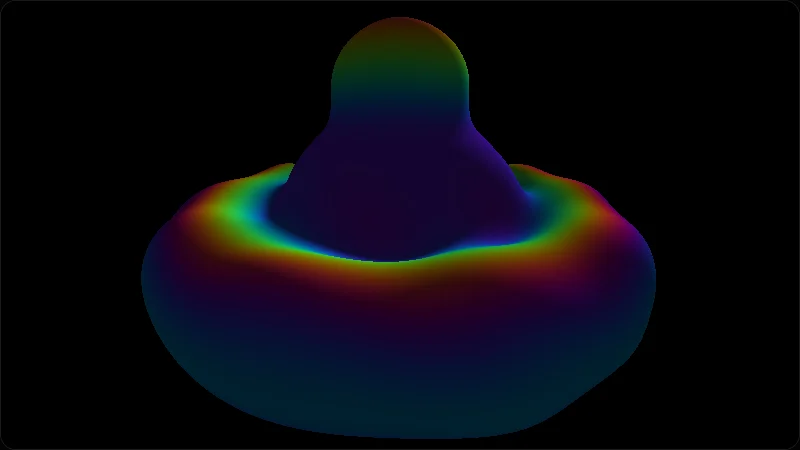
WebGL 2.0 current SDF scene
The scene used when you start the WebGL 2.0 test.
Both images were captured with the same starting camera, medium load and 800 × 450 resolution.
Historical WebGL 1.0 test results
These published records include device, load, average FPS and score. Open the full results for browser and test conditions.
These results use the original WebGL 1.0 engine. They cannot be compared with the current WebGL 2.0 test.
| Device | Mode | FPS | Score |
|---|---|---|---|
MacBook Air 13 M1 Apple M1 7-core GPU | Medium load | 52 | 15,600 |
MacBook Air 13 M2 Apple M2 8-core GPU | Medium load | 61 | 18,300 |
Intel UHD 620 laptop Intel UHD Graphics 620 | Light load | 42 | 4,200 |
Desktop RTX 3060 NVIDIA GeForce RTX 3060 | Heavy load | 74 | 37,074 |
Desktop RTX 4070 NVIDIA GeForce RTX 4070 | Heavy load | 112 | 56,112 |
What this test measures
- Average FPS for a WebGL rendering workload
- Lowest and highest sampled FPS
- Frame time and FPS stability during the run
- Repeat comparisons with matching test conditions
Test methodology updates
Migrated the benchmark engine to WebGL 2.0.
Introduced a separately maintained SDF scene and labeled all historical WebGL 1.0 rows as a non-comparable archive.
Added public methodology, device reports and reviewed result tables.
Pages now separate local benchmark execution from opt-in public data and explain score limits.
Published first methodology article.
Documented test modes, FPS interpretation and privacy boundaries.
Initial browser raymarching benchmark launch.
Released the original legacy engine with Light, Medium, Heavy and Extreme modes.
How to read average FPS
FPS is the number of frames rendered per second. These ranges describe this test workload.
An average of at least 60 frames per second. The display refresh rate may limit the result.
An average of 30 to fewer than 60 frames per second.
An average of 15 to fewer than 30 frames per second. Try the light-load test to measure a less demanding workload.
An average below 15 frames per second. FPS alone cannot identify the cause.
These bands describe only this workload. Compare the same engine, mode, resolution and browser conditions.
Tips for phones & tablets
- Keep the same power source and battery-saver setting between comparisons.
- Close background apps before starting.
- Start with light or medium load, then use higher loads if needed.
- Let the device return to a similar temperature before repeating.
Tips for Chrome / Edge / Safari
- Enable hardware acceleration in your browser settings.
- On Chrome / Edge open chrome://gpu to confirm WebGL 2 is using your GPU.
- On laptops, force the dedicated GPU instead of integrated graphics.
- Close other heavy tabs — a video on another tab can starve the benchmark.
How this test compares
| Test | Runs in browser | Focus | Install required |
|---|---|---|---|
| Volume Shader BM Test | Yes | GPU raymarching, shader ALU stress | No |
| WebGL Aquarium | Yes | Lightweight scene, polygon throughput | No |
| 3DMark | No | Comprehensive native benchmark | Yes |
Dead Pixel Check: How to Test Your Screen for Dead or Stuck Pixels
Check your screen with solid colors, identify persistent dark or bright dots, and record pixel issues separately from browser GPU performance.
MacBook WebGL GPU Test Results
MacBook Air M1 and M2 browser GPU reference rows, test conditions, fanless thermal notes and fair comparison rules.
Technical Principles
Volume Shader BM uses WebGL raymarching: WebGL 2.0 is the default current engine, while an optional WebGL 1.0 engine preserves the original benchmark algorithm. Unlike traditional polygon-based game benchmarks, both paths run a heavy Raymarching workload.
- Volume Rendering: We do not use any 3D model files. All pixels on the screen are calculated in real-time through mathematical formulas (SDF signed distance fields).
- Shader Load: The test runs in the fragment shader. Heavy mode allows up to 1002 ray steps per pixel, with early exit when the ray reaches the scene or leaves the test volume.
- Real Stress: This isolates one browser WebGL fragment-shader workload. It does not measure AI inference, scientific computing, game performance, or the GPU's overall theoretical peak.
Frequently Asked Questions (FAQ)
Why does my device heat up severely during testing?
Heavy modes keep the fragment shader busy and can increase power use and heat. Actual GPU utilization varies by device, browser, resolution, and thermal limits. Stop the test if the device becomes unusually hot or unstable.
What does the test score mean?
The score is average FPS × normalized workload (ray steps and solver accuracy) × 100. Test duration is not part of the formula. Compare only results from the same engine version, mode, resolution, and browser conditions.
Why does the screen look laggy (low FPS)?
Low FPS can reflect the workload, resolution, browser acceleration, power settings or heat. Try Light and repeat under the same conditions; FPS alone does not diagnose a GPU fault.
Will my data be uploaded?
Rendering and results stay local by default. If you enable optional analytics, test events and summary metrics such as FPS may be sent to Google Analytics. The GPU renderer and full browser version are not included in those events.